
House prices increased by 2.3% in Monmouthshire in September, new figures show.
The rise contributes to the longer-term trend, which has seen property prices in the area grow by 4.7% over the last year – the highest in Wales.
The average Monmouthshire house price in September was £367,984, Land Registry figures show – a 2.3% increase on August.
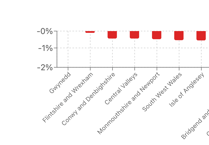
Over the month, the picture was different to that across Wales, where prices decreased 0.9%, and Monmouthshire was above the 0.5% drop for the UK as a whole.


Over the last year, the average sale price of property in Monmouthshire rose by £17,000 – putting the area top among Wales’s 22 local authorities with price data for annual growth.
At the other end of the scale, properties in Blaenau Gwent lost 11.2% of their value, giving an average price of £118,000.
First steps on the property ladder
First-time buyers in Monmouthshire spent an average of £284,000 on their property – £13,000 more than a year ago, and £78,000 more than in September 2018.
By comparison, former owner-occupiers paid £429,000 on average in September – 50.8% more than first-time buyers.
Property types
Owners of semi-detached houses saw the biggest rise in property prices in Monmouthshire in September – they increased 2.6%, to £306,934 on average. Over the last year, prices rose by 5%.
Among other types of property:
- Detached: up 2.2% monthly; up 4.9% annually; £535,287 average
- Terraced: up 2.4% monthly; up 3.9% annually; £247,706 average
- Flats: up 1.4% monthly; up 4.1% annually; £172,812 average
How do property prices in Monmouthshire compare?
Buyers paid more for properties in Monmouthshire than anywhere else in Wales in September. The average price paid would buy 3.1 homes in Blaenau Gwent (£118,000), at the other end of the scale.
The highest property prices across the UK were in Kensington and Chelsea.
Across Wales, property prices are low compared to those across the UK, where the average cost is £291,000.
Factfile
Average property price in September
- Monmouthshire: £367,984
- Wales: £214,912
- UK: £291,385
Annual change to September
- Monmouthshire: +4.7%
- Wales: -2.7%
- UK: -0.1%
Highest and lowest annual growth in Wales
- Monmouthshire: +4.7%
- Blaenau Gwent: -11.2%